Semiconductors 2026: New Paradigm?
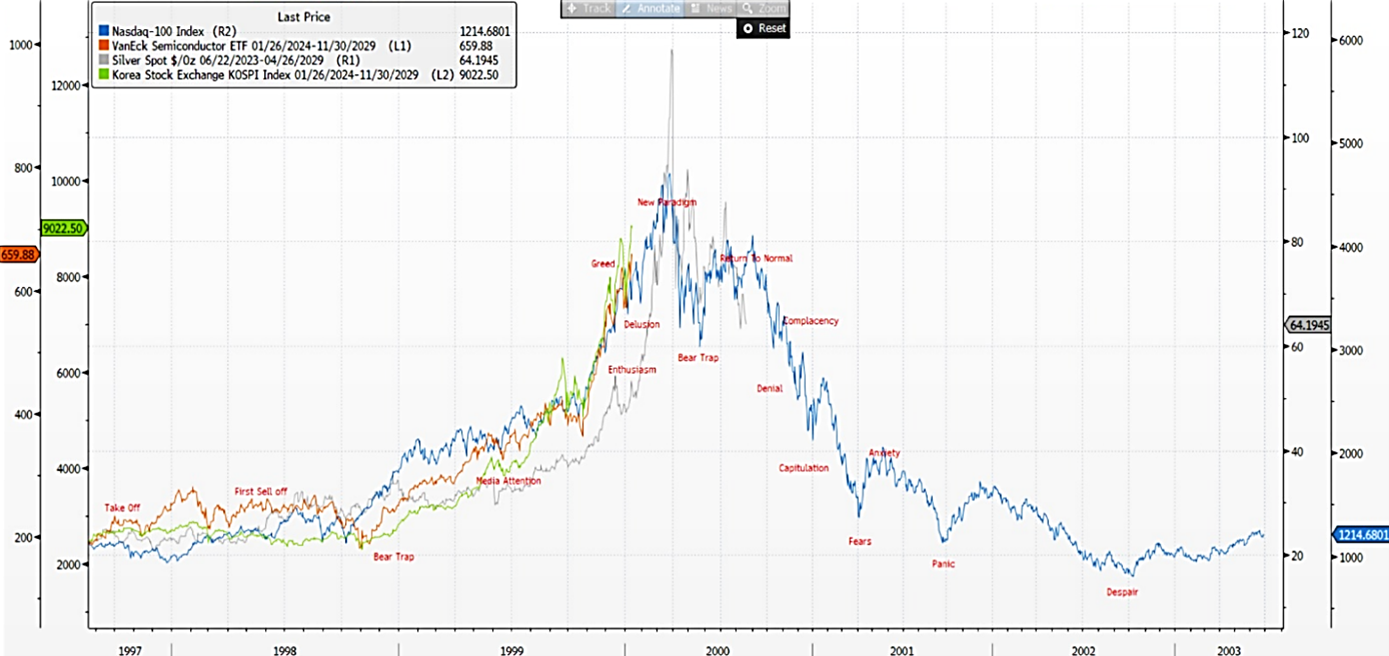
The final stages of major bubbles often look remarkably similar. Whether it was the Dot-Com Bubble in 2000 or Silver in 2025, the pattern was the same: a period of doubt, a final surge of optimism, and ultimately a dramatic resolution.
The question for investors today is simple:
Are semiconductors entering their own "New Paradigm" phase, or does one final "Delusion" correction still lie ahead?
History suggests that major speculative bubbles follow a surprisingly consistent psychological pattern. Near the end of the cycle, investors become convinced that traditional valuation metrics no longer apply and that a fundamentally new era has begun. This is the classic New Paradigm phase.
The final advance is often spectacular.
During the last stage of the Dot-Com Bubble, from January to March 2000, technology stocks entered a near-vertical ascent. The Nasdaq gained approximately 20% in less than three months before reaching its historic peak.
Silver's 2025 rally was even more dramatic. During its final advance, the metal surged roughly 50% in just a few months, making its blow-off phase significantly more euphoric than the final stage of the Dot-Com Bubble.
Today, semiconductor stocks, the SOX Index, the SMH ETF, and technology-heavy Asian markets such as the KOSPI are exhibiting characteristics that invite comparisons with previous speculative episodes. The key question is whether the market has already entered its final New Paradigm phase or whether investors must first endure one last Delusion phase—a corrective decline of roughly 10–20% that temporarily shakes confidence before the final speculative surge higher.
Or perhaps, as investors always argue near major turning points:
"This time is different."
AMD 2026 vs. Cisco 2000: A Long-Term P/E Comparison
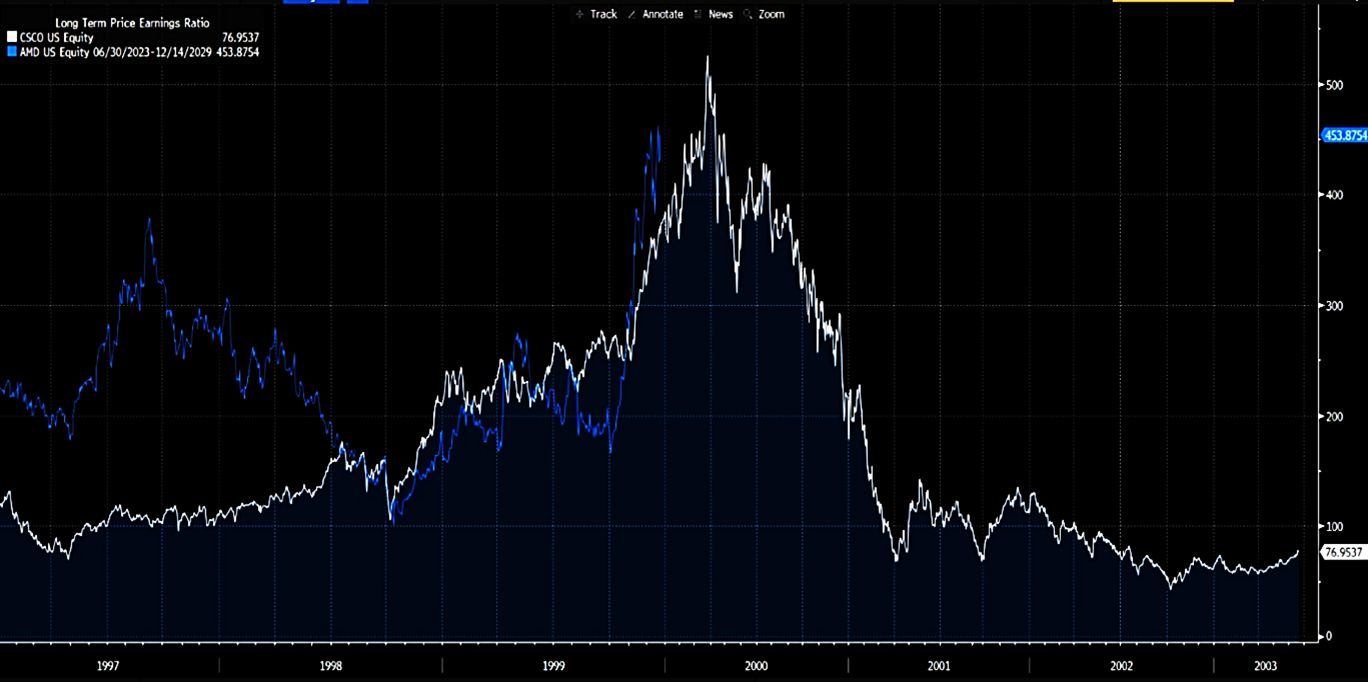
One of the most striking comparisons today is the similarity between AMD's long-term P/E ratio in 2026 and Cisco's long-term P/E ratio at the peak of the Dot-Com Bubble in March 2000.
In March 2000, investors valued Cisco as if years of exceptional growth were already guaranteed. Today, AMD's long-term valuation reflects a similarly optimistic view of future earnings, raising the question of whether investors are once again extrapolating today's growth too far into the future.
The broader semiconductor sector reflects a similar dynamic. The Philadelphia Semiconductor Index (SOX) is currently trading at valuation levels that, by historical standards, are exceptionally rich. Current estimates place the SOX long-term P/E ratio above 100x, a level rarely observed outside periodsof extreme optimism.
For historical perspective:
- The Nasdaq 100 reportedly reached trailing P/E levels near 80x around the March 2000 peak, with forward multiples exceeding 100x in some estimates.
- The broader Nasdaq Composite reached even more extreme valuations, with some estimates approaching 200x earnings.
- During Japan's late-1980s asset bubble, the Nikkei and TOPIX traded near 50–60x earnings, while certain sectors exceeded 100x.
Valuation alone, however, has never been a reliable timing tool. Markets can remain expensive far longer than most investors expect, especially when earnings growth remains strong.
The Critical Difference Between 2000 and Today
The most important distinction between the current AI boom and the Dot-Com Bubble lies in the gap between trailing and forward valuations.
In 2000, investors were paying extraordinary multiples on both current earnings and projected future earnings. The market was not merely pricing growth— it was pricing perfection.
Today's AI leaders present a different picture.
Companies such as Nvidia are already generating enormous revenues, profits, and free cash flow. While trailing valuation multiples remain elevated, forward multiples are dramatically lower because analysts expect earnings to grow rapidly over the coming years.
That does not mean the market is necessarily correct. Analysts can be just as optimistic as investors were in 2000.
But unlike many of the market darlings of the Dot-Com era, today's AI leaders are not promising future profits— they are already producing them.
The debate is no longer whether earnings will ever arrive.
The debate is whether earnings growth can be large enough to justify the expectations already embedded in today's prices.
Nvidia: Same Company, Two Bubbles, Two Very Different Outcomes
Take Nvidia: the same company, two bubbles, two very different outcomes.
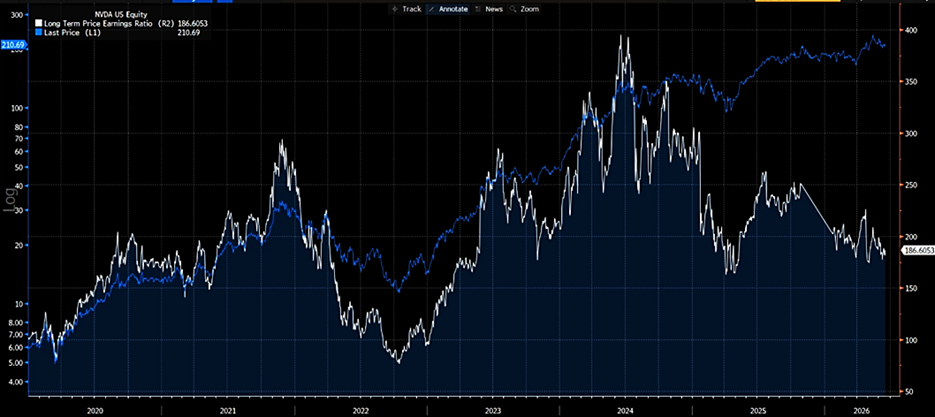
During the 2021 "Tech Disruptor" bubble, Nvidia's long-term P/E ratio briefly approached 300x, according to Bloomberg data. When sentiment reversed, the stock collapsed by roughly 66%, driving the valuation multiple back toward 100x within a year.
In the 2024 semiconductor "early-stage" AI bubble, Nvidia's long-term P/E ratio reached even more extreme levels—approximately 400x. Yet the stock never experienced anything close to a comparable crash. Instead, Nvidia endured a relatively modest 25% drawdown followed by a lengthy "correction through time," trading largely sideways while earnings rapidly expanded. By early 2025, the P/E ratio had fallen toward 150x despite limited damage to the share price.
The lesson is that valuation excesses do not always resolve through market crashes. Sometimes they are normalized by rapidly growing earnings.
Even today, Nvidia's trailing valuation remains elevated, while its forward P/E is dramatically lower. The market is effectively saying:
"Yes, the valuation looks absurd—unless the company delivers."
This highlights the key difference between many speculative episodes of the past and today's AI leaders. The debate is no longer whether earnings will ever arrive. The debate is whether earnings growth can be large enough to justify the expectations already embedded in current prices.
The Bull Case vs. The Bear Case
The Bear Case
Semiconductor valuations are approaching levels historically associated with speculative excess. If earnings growth disappoints, today's prices may prove difficult to justify and a significant correction could follow.
The Bull Case
Unlike previous bubbles, today's leaders are already generating enormous revenues, profits, and free cash flow. If AI adoption continues at scale and earnings growth remains exceptional, valuations may normalize through earnings growth rather than falling stock prices.
The Verdict
Ultimately, the outcome may not depend on whether this is a bubble.
It may depend on whether earnings can outrun the bubble.
Which brings us to the central question:
Will the semiconductor industry and the broader AI ecosystem deliver enough earnings growth to justify today's expectations, or are investors once again paying tomorrow's profits at today's prices?